Creating a Real-Time Candlestick Chart Using WebSocket
This tutorial demonstrates how to subscribe to Upbit’s real-time candlestick stream using WebSocket and visualize the data with a live chart.
Get Started
To develop trading strategies based on price trends and trading activity, it is often necessary to collect data over extended periods. Rather than repeatedly calling the REST API, you can subscribe to a real-time data stream using a WebSocket connection. This tutorial demonstrates how to subscribe to live candlestick (candle) data via WebSocket and visualize it in a dynamic chart.
You can find a general introduction to Websocket Usage Guide, including usage patterns and error handling, in the WebSocket Guide.
- Singapore (sg): https://sg-api.upbit.com
- Indonesia (id): https://id-api.upbit.com
- Thailand (th): https://th-api.upbit.com
Development Environment & Libraries
This tutorial uses Python as the primary language. Refer to the Development Environment Setup Guide to set up your Python environment. To receive WebSocket data, we use the websocket-client library, and for chart visualization, we use pandas and matplotlib. Install the required libraries in your (virtual) environment using the following command:
pip install websocket-client matplotlib pandasSubscribing to Real-Time Candle Streams via WebSocket
First, let’s write Python code to subscribe to the real-time candlestick stream. The example below uses the websocket-client library to establish a WebSocket connection and subscribe to 1-second candle data. The run_ws() function connects to the Upbit WebSocket. We use threading to run the WebSocket connection in a separate thread.
In the on_open function, a subscription message for the candle.1s stream is sent once the connection is established. This example subscribes to the SGD-BTC trading pair.
import websocket
import threading
import uuid
import json
import time

def on_open(ws):
    print("WebSocket connected")
    subscribe_message = [
        {"ticket": str(uuid.uuid4())},
        {"type": "candle.1s", "codes": ["SGD-BTC"]}
    ]
    ws.send(json.dumps(subscribe_message))

def on_message(ws, message):
    try:
        obj = json.loads(message)
        print(obj)
    except Exception:
        print("Received(raw):", message)
        return

def on_error(err):
        print("Error:", err)

def on_close():
        print("Closed")

def run_ws():
    ws = websocket.WebSocketApp(
        "wss://sg-api.upbit.com/websocket/v1",
        on_open=on_open,
        on_message=on_message,
        on_error=on_error,
        on_close=on_close
    )
    ws.run_forever(ping_interval=30, ping_timeout=10, reconnect=2)

ws_thread = threading.Thread(target=run_ws, daemon=True)
ws_thread.start()

try:
    while True:
        time.sleep(1)
except KeyboardInterrupt:
    pass
Once connected, the subscription message is sent and you will start receiving 1-second candle data. To extract the necessary fields for visualization and store the data, define the on_message(ws, message) function as shown below, and include it in your WebSocket connection. This function will be executed automatically every time a message is received.
import websocket
import threading
import json
import pandas as pd

candle_data_list = []
data_lock = threading.Lock()

def on_message(ws, message):
    """Receive live candle data from Upbit WebSocket and store it in a list."""
    global candle_data_list
    data = json.loads(message)

    if data.get('type') == 'candle.1s':
        candle_time = data['candle_date_time_utc']
        opening_price = float(data['opening_price'])
        high_price = float(data['high_price'])
        low_price = float(data['low_price'])
        close_price = float(data['trade_price'])
        volume = float(data['candle_acc_trade_volume'])

        with data_lock:
            timestamp = pd.to_datetime(candle_time)
            candle_data_list.append({
                'timestamp': timestamp,
                'open': opening_price,
                'high': high_price,
                'low': low_price,
                'close': close_price,
                'volume': volume
            })
            # Keep only the latest 50 candles
            if len(candle_data_list) > 50:
                candle_data_list = candle_data_list[-50:]

def on_open(ws):
    """Send the subscription message on WebSocket connection."""
    print("WebSocket connected")
    subscribe_message = [
        {"ticket": "test_unique_identifier_89asydfhnmn2_34"},
        {
            "type": "candle.1s",
            "codes": ["SGD-BTC"],
        }
    ]
    ws.send(json.dumps(subscribe_message))

def run_ws():
    """Run the WebSocket client in a separate thread."""
    ws = websocket.WebSocketApp(
        "wss://sg-api.upbit.com/websocket/v1",
        on_message=on_message,
        on_open=on_open
    )
    ws.run_forever()

# Start the WebSocket thread (for data collection)
ws_thread = threading.Thread(target=run_ws, daemon=True)
ws_thread.start()
The example above defines a list candle_data_list to store candlestick data for charting. Each time a message is received, key candle fields are extracted and appended to the list.
Now, let’s move on to rendering the chart based on the stored data.
Full Code Example
import websocket
import threading
import uuid
import json
import time
import pandas as pd
import matplotlib.pyplot as plt
from matplotlib.animation import FuncAnimation

candle_data_list = []
data_lock = threading.Lock()

def on_open(ws):
    print("WebSocket connected")
    subscribe_message = [
        {"ticket": str(uuid.uuid4())},
        {"type": "candle.1s", "codes": ["SGD-BTC"]}
    ]
    ws.send(json.dumps(subscribe_message))

def on_message(ws, message):
    global candle_data_list
    data = json.loads(message)

    if data.get('type') == 'candle.1s':
        candle_time = data['candle_date_time_utc']
        opening_price = float(data['opening_price'])
        high_price = float(data['high_price'])
        low_price = float(data['low_price'])
        close_price = float(data['trade_price'])
        volume = float(data['candle_acc_trade_volume'])

        with data_lock:
            timestamp = pd.to_datetime(candle_time)
            candle_data_list.append({
                'timestamp': timestamp,
                'open': opening_price,
                'high': high_price,
                'low': low_price,
                'close': close_price,
                'volume': volume
            })
            if len(candle_data_list) > 50:
                candle_data_list = candle_data_list[-50:]

def on_error(err):
        print("Error:", err)

def on_close():
        print("Closed")

def run_ws():
    ws = websocket.WebSocketApp(
        "wss://sg-api.upbit.com/websocket/v1",
        on_open=on_open,
        on_message=on_message,
        on_error=on_error,
        on_close=on_close
    )
    ws.run_forever(ping_interval=30, ping_timeout=10, reconnect=2)

def update_chart(frame):
    with data_lock:
        if len(candle_data_list) < 2:
            return

        data_copy = candle_data_list.copy()

    ax1.clear()
    ax2.clear()

    timestamps = [d['timestamp'] for d in data_copy]
    opens = [d['open'] for d in data_copy]
    highs = [d['high'] for d in data_copy]
    lows = [d['low'] for d in data_copy]
    closes = [d['close'] for d in data_copy]
    volumes = [d['volume'] for d in data_copy]

    for i, (ts, o, h, l, c) in enumerate(zip(timestamps, opens, highs, lows, closes)):
        color = 'red' if c >= o else 'blue'
        ax1.plot([i, i], [o, c], color=color, linewidth=12)
        ax1.plot([i, i], [l, h], color=color, linewidth=2)

    ax1.set_title('Upbit SGD-BTC Real-time 1s Candlestick Chart', fontsize=14)
    ax1.set_ylabel('Price (SGD)', fontsize=12)
    ax1.grid(True, alpha=0.3)

    if len(timestamps) > 0:
        step = max(1, len(timestamps) // 10)
        ax1.set_xticks(range(0, len(timestamps), step))
        ax1.set_xticklabels([ts.strftime('%H:%M:%S') for ts in timestamps[::step]],
                            rotation=45, fontsize=10)

    ax2.bar(range(len(volumes)), volumes, color='gray', alpha=0.6)
    ax2.set_ylabel('Volume', fontsize=12)
    ax2.set_xlabel('Time', fontsize=12)
    ax2.grid(True, alpha=0.3)

    if len(timestamps) > 0:
        ax2.set_xticks(range(0, len(timestamps), step))
        ax2.set_xticklabels([ts.strftime('%H:%M:%S') for ts in timestamps[::step]],
                            rotation=45, fontsize=10)

    plt.tight_layout()

ws_thread = threading.Thread(target=run_ws, daemon=True)
ws_thread.start()

fig, (ax1, ax2) = plt.subplots(2, 1, figsize=(12, 10), gridspec_kw={'height_ratios': [3, 1]})

ani = FuncAnimation(fig, update_chart, interval=1000, cache_frame_data=False)
plt.show()
When you run this code, the following steps occur:
- A new thread is created to connect to the Upbit public WebSocket server and send a subscription message for 1-second candle data on the SGD-BTC pair.
- Each received candle is added to a list (up to 50 records).
- The main thread runs a chart animation that updates once per second with the latest candle data.
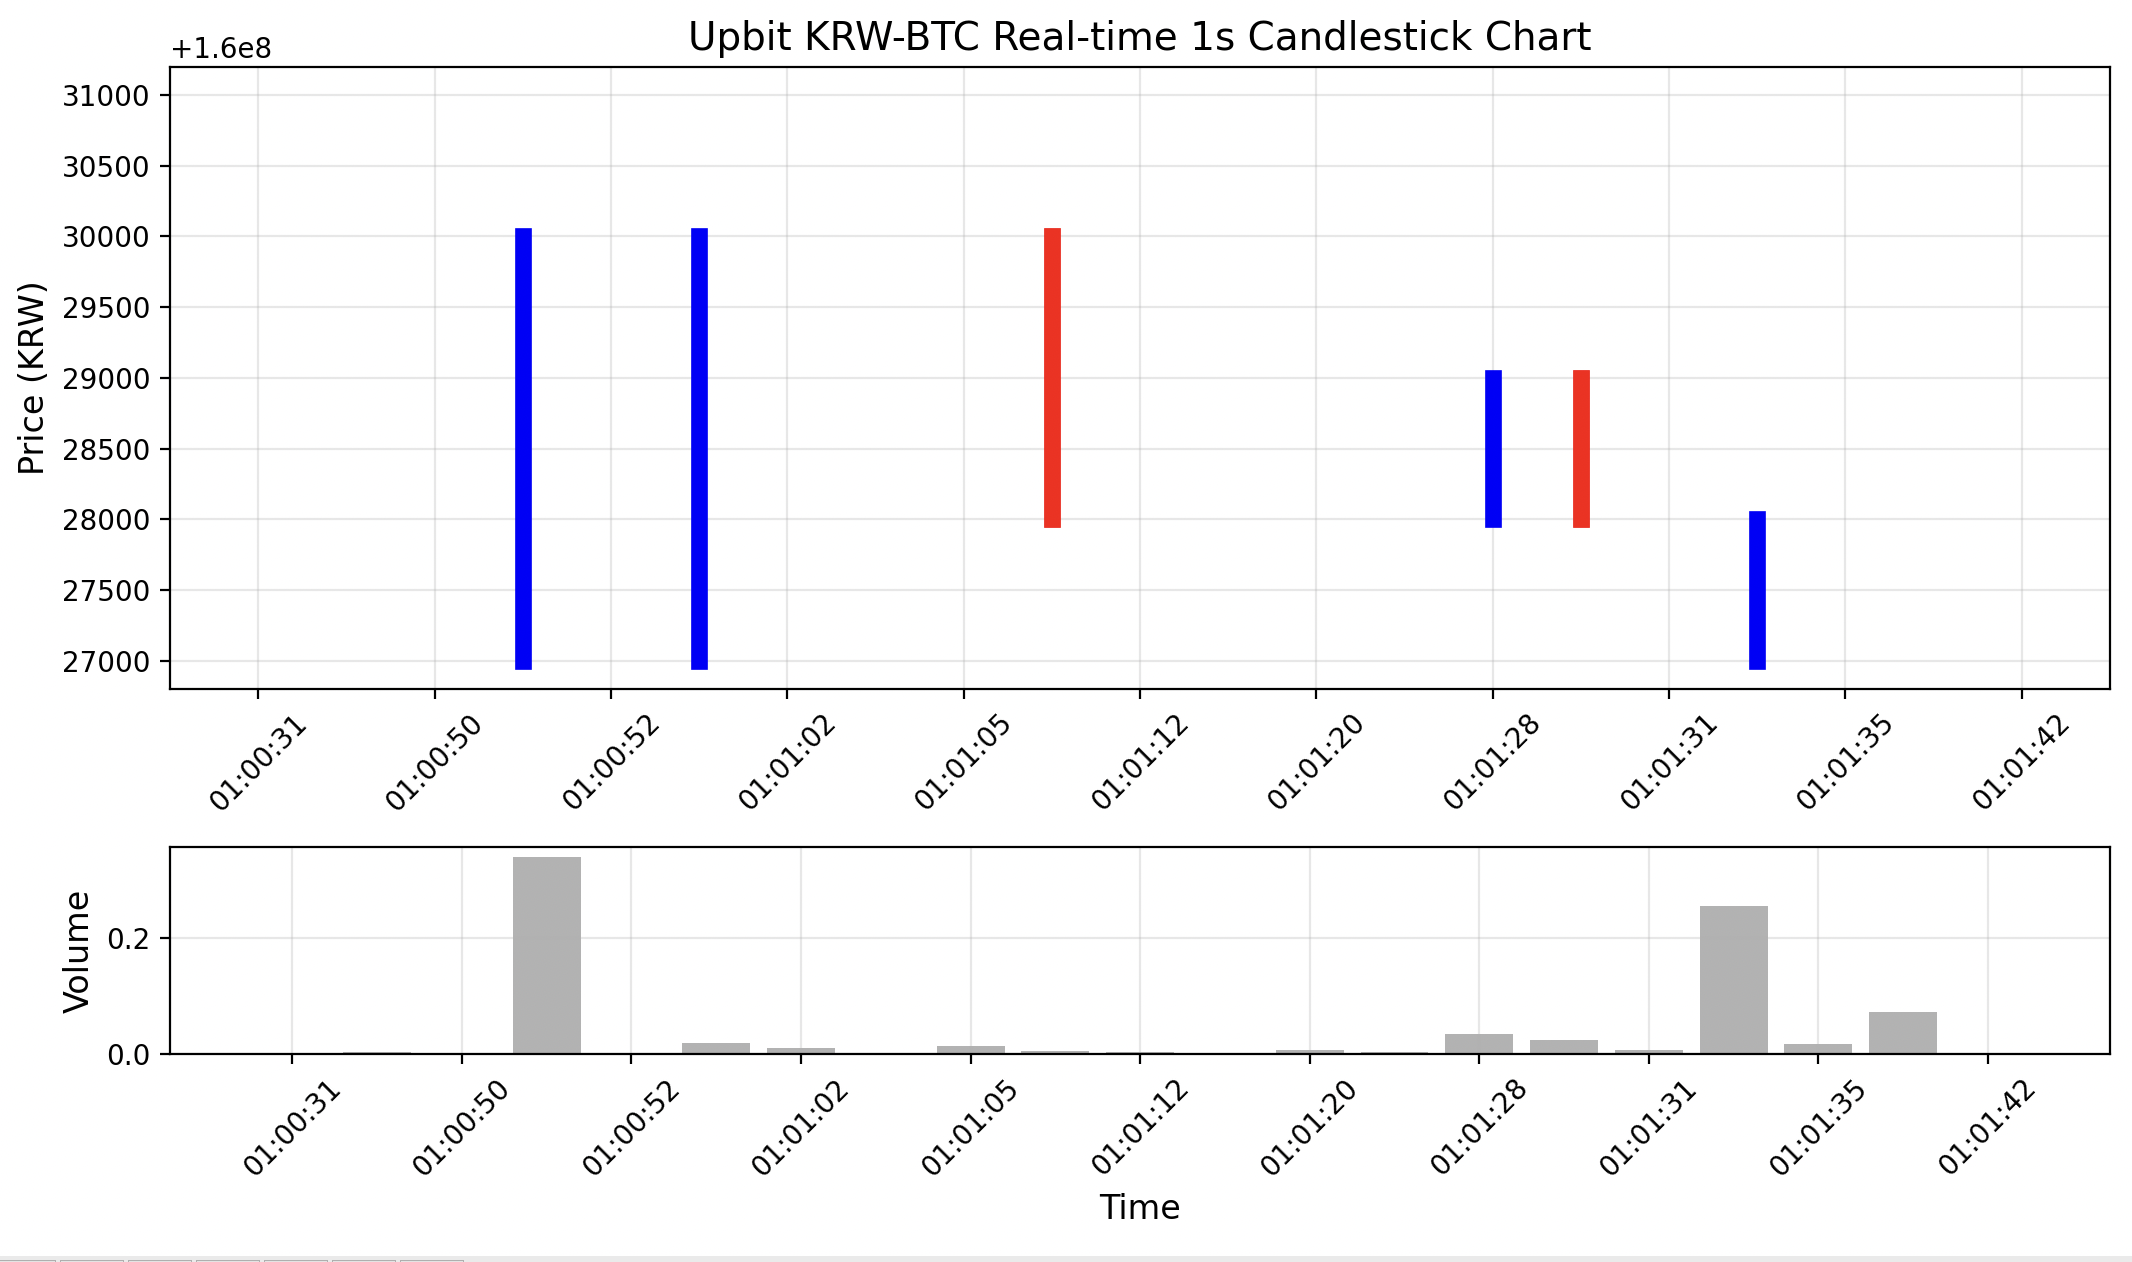
A real-time candlestick chart will appear as shown below.
Note: Candle data is received only when trades occur within the given interval. If there are no trades in a second, or if only a single trade price is recorded, the chart may not update. This is expected behavior.
Wrapping Up
In this tutorial, we built an example that uses WebSocket to receive real-time candle data and render it as a live chart.
You can adapt this example to save the data to a file or implement real-time analysis features, which can then be applied to develop trading strategies.
Updated 10 months ago